
Every vessel has a sweet spot. A specific trim where the hull moves through water with minimum resistance. Where the engine burns less fuel for the same speed.
On mainliners, we calculate this to the centimeter. Shore planners run simulations for every leg, adjusting ballast transfers to maintain optimal trim. We monitor deviations in percentages, not tons, because percentages scale across any vessel class.
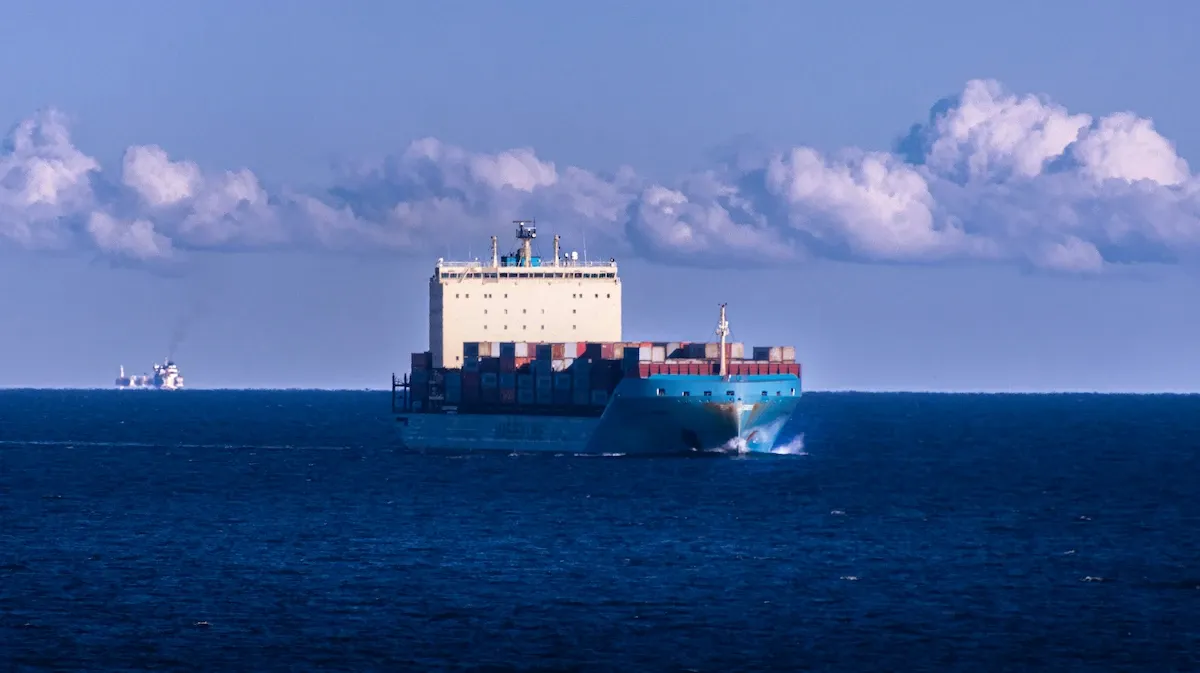
On feeders, I see the same thing over and over: 2.0 meters by the stern. Every voyage. Every leg. “Because that’s what we always do.”
That habit is costing you 2-4% of your annual fuel bill. On a typical feeder: $30,000-70,000 per year.
Why Percentages Matter More Than Tons
When feeder operators ask “How many tons will I save?”, they’re asking the wrong question.
A 2,500 TEU feeder consuming 35 tons per day and a 1,200 TEU feeder consuming 18 tons per day will save different absolute amounts. But both save the same percentage if they optimize trim correctly.
Here’s what peer-reviewed studies on container ship hydrodynamics show:
| Trim improvement | Fuel consumption reduction |
|---|---|
| 2.1m to 1.5m stern | 1.5-2.0% |
| 2.1m to 0.9m stern | 2.5-3.5% |
| 2.1m to 0.6m stern | 3.0-4.0% |
The exact percentage depends on speed, draft, hull design, and sea state. But the range is consistent across vessel classes.
The Tool Nobody Uses: Performance Tables
Every vessel has performance tables from sea trials. They show exactly how fuel consumption changes with speed, draft, and trim. The data is specific to your hull.
On mainliners, we cross-reference actual consumption against these tables daily. We identify deviations. We adjust trim targets based on real performance data.
On most feeders, these tables sit in a drawer untouched. The information exists. The process to use it doesn’t.
A Real Example: MV Med Express
Let me show you how this works on a typical vessel.
Vessel: MV Med Express, 2,800 TEU feeder, 5 years old
Route: Weekly Mediterranean rotation, 7 ports, 6 sea days average
Baseline consumption: 42 tons/day at 14 knots
Observed trim: Consistent 1.8-2.1m stern regardless of loading condition
Optimal trim: 0.5-0.9m stern based on performance table data
The gap: 1.2m average excess stern trim
| Metric | Value |
|---|---|
| Fuel penalty | 3.2% overconsumption |
| Daily excess | 1.34 tons |
| Annual excess (300 sea days) | 403 tons |
| Annual cost at $600/ton | $241,800 |
3.2% sounds small. $241,800 is not small.
A fleet of 8 feeders with the same issue: nearly $2 million per year in avoidable fuel costs.
Why 2.0m Stern Became “Standard”
I understand where it comes from.
Stern trim improves propeller immersion. It keeps the bow light for better seakeeping. For partially loaded vessels in heavy weather, it makes sense.
But a feeder at 85% capacity on a calm summer rotation? Running 2.0m stern trim is leaving money in the water.
The problem is that nobody checks. The loading computer confirms stability. The departure draft is legal. Nobody asks: “Is this the right trim for this voyage?”
What Optimal Trim Actually Looks Like
Every hull is different. But for feeders in the 2,000-4,000 TEU range:
| Loading condition | Optimal trim |
|---|---|
| 70-80% capacity | 0.8-1.0m stern |
| 80-90% capacity | 0.5-0.8m stern |
| 90%+ capacity | 0.3-0.6m stern |
The key insight: optimal trim changes with draft. At lighter drafts, you need more stern trim for propeller immersion. At deeper drafts, you want the hull as level as possible to reduce wave-making resistance.
“Always 2.0m stern” is optimized for one condition and wrong for everything else.
Variables That Move the Percentage
Speed. Slow steaming (8-10 knots): 1.5-2.5% savings. Service speed (14-16 knots): 3-4% savings.
Draft. Deeper immersion changes the curve. A fully laden vessel responds differently than one at 70% capacity.
Sea state. In waves, trim optimization benefits can be 30% higher than in calm water.
Hull condition. Fouled hull elevates baseline consumption, making trim optimization even more visible.
The Ballast Trade-Off
“To reduce stern trim, I need to shift ballast forward. That takes time.”
True. But compare:
Keep 2.0m stern: Zero effort. 3% fuel penalty continues. On a 7-day rotation: $5,280 lost.
Optimize trim: 2-3 hours ballast transfer. $5,150 saved per rotation.
Over 40 rotations: $206,000 difference.
On mainliners, we plan ballast movements as part of the stowage plan. Before the vessel arrives, the planner already knows which tanks to fill and empty. The optimization is built in.
What You Can Do Today
Step 1: Find your vessel’s performance tables. They exist. Sea trials produced them.
Step 2: Identify optimal trim for your typical loading conditions. Cross-reference average draft with the performance curves.
Step 3: Calculate optimal trim for each leg. Check expected draft at arrival, sea state forecast, port restrictions.
Step 4: Plan ballast accordingly. Work backwards from optimal arrival trim.
Step 5: Track results. Same route, same speed, different trim. The percentage difference will speak for itself.
What a Shore Planner Does Differently
A dedicated shore planner:
- Calculates optimal trim for every leg, not just departure
- Coordinates ballast movements with cargo operations to avoid delays
- Considers the full rotation, not just this port but the next three
- Simulates scenarios: “If we load heavy cargo in bay 50, how does it affect trim in Algeciras?”
- Tracks patterns across months, identifying systematic improvements
On one vessel I supported, standard cargo distribution was producing 0.4m excess stern trim consistently. By adjusting cargo placement priorities, we reduced trim deviation by 60%. Annual savings: $38,000. No operational changes. Just smarter planning.
The ROI
Assume 2.5% fuel savings on a feeder consuming 35 tons/day:
| Factor | Value |
|---|---|
| Annual consumption | 10,500 tons |
| 2.5% savings | 262 tons |
| Value at $600/ton | $157,200 |
| Shore planning service | $18,000/year |
| Net benefit | $139,200/year |
| ROI | 8.7x |
Even at the conservative end (1.5% savings), ROI is over 4x.
The Conversation That Happens Every Week
Last departure before a long sea passage. I call the Chief Officer.
“Chief, the plan shows 1.5m stern trim. We should discharge ballast after departure to bring it down to 0.6m.”
Pause.
“But then the stresses go up to 95%.”
“Chief, 95% is not 100%. We have to do it.”
“It’s extra work. We’re already tight on time.”
“I understand. But we can’t afford to leave $30,000-70,000 at the departure port. That money needs to come with us. It goes in the safe at the arrival port, or it doesn’t exist.”
Twenty minutes later, ballast discharge was planned. Trim on arrival: 0.6m.
This conversation happens every week on mainliners. On feeders, nobody is making that call.
Safety and Performance First. That’s not a slogan. That’s the difference between vessels that optimize and vessels that don’t.
The Bigger Picture
Trim optimization requires just attention and process.
Your Chief Officer has too much to do. Trim optimization is one more thing on an impossible list.
Either build the process yourself, or find someone whose job is making sure it happens.
Either way, stop leaving $30,000-70,000 in the water.
Every meter of excess trim is money overboard. Stop the leak.